u

Statistical Analysis of the Heavy Neutral Atoms Measured by IBEX

by Park et al.

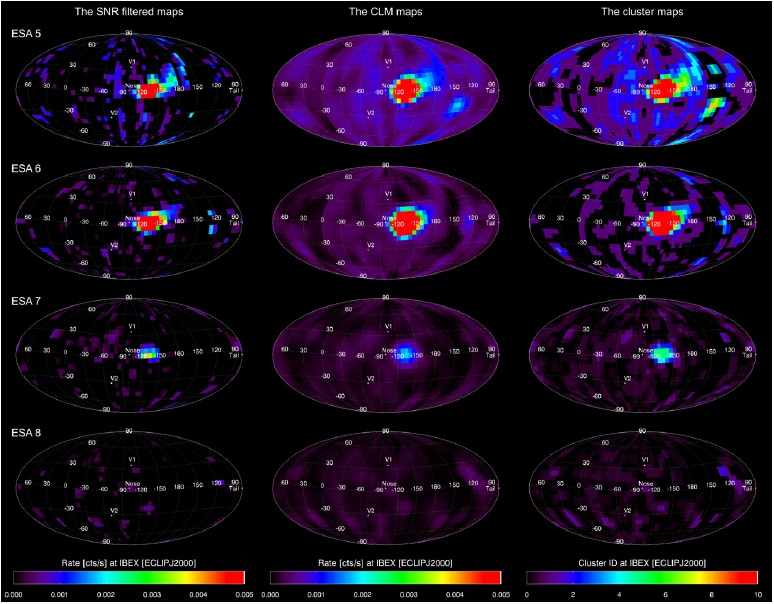
Abstract: We investigate the directional distribution of heavy neutral atoms in the heliosphere by using heavy neutral maps generated with the IBEX -Lo instrument over three years from 2009 to 2011. The interstellar neutral (ISN) O&Ne gas ow was found in the first-year heavy neutral map at 601 keV and its ow direction and temperature were studied. However, due to the low counting statistics, researchers have not treated the full sky maps in detail. The main goal of this study is to evaluate the statistical significance of each pixel in the heavy neutral maps to get a better understanding of the directional distribution of heavy neutral atoms in the heliosphere. Here, we examine three statistical analysis methods: the signal-to-noise filter, the confidence limit method, and the cluster analysis method. These methods allow us to exclude background from areas where the heavy neutral signal is statistically significant. These methods also allow the consistent detection of heavy neutral atom structures. The main emission feature expands toward lower longitude and higher latitude from the observational peak of the ISN O&Ne gas ow. We call this emission the extended tail. It may be an imprint of the secondary oxygen atoms generated by charge exchange between ISN hydrogen atoms and oxygen ions in the outer heliosheath.

Associated Data Products:

IBEX-Lo Heavy Neutral Maps

The IBEX-Lo heavy neutral maps are produced from the measured direct events identified as “Oxygen”, which are registered between 50 ns and 100 ns in TOF2; i.e. 50 ns ≤ TOF2 ≤ 100 ns (Park et al. 2015). There are three different types of maps included:

  1. single_ot_maps

  2. There are six sets of the single IBEX-Lo heavy neutral maps observed from 2009 to 2011.
    • Six sets of maps for three consecutive years: map1–6
    • Four E-steps: E-step 5–8
    • Elements: counts, exposure times, count rates, standard deviations of count rates, S/N
  3. combo_ot_maps (Fig. 1, 2, and 3 in Park et al. 2015)

  4. There are three sets of the combined IBEX-Lo heavy neutral maps
    • comb-ot-m1m3m5: Combined odd maps (map1 + map3 + map5)
    • comb-ot-m2m4m6: Combined even maps (map2 + map4 + map6)
    • comb-ot-m1m6: Combined all maps (map1 + map2 + map3 + map4 + map5 + map6)
    • Elements: exposure times, count rates, standard deviations of count rates, S/N
  5. statistical_ot_maps (Fig. 4 and 5 in Park et al. 2015)

  6. There are four sets of the statistical IBEX-Lo heavy neutral maps. Three statistical methods
    were applied to the combined all maps.
    • combo-ot-m1m6-snr: S/N-filtered maps
    • combo-ot-m1m6-clm: CLM maps
    • combo-ot-m1m6-snr-clm: S/N-filtered CLM maps
    • combo-ot-m1m6-cluster: Cluster maps
Fig. 4 of Park et al. 2015: Sky maps in which three statistical methods were applied: the signal-to-noise filter (left), the confidence limit method (middle), and the cluster method (right). The S/N filtered maps show the count rates in pixels with S/N values exceeding a threshold. The CLM maps represent the upper confidence limits for CL = 84.13%. The cluster maps illustrate the cluster IDs, which correspond to the counts per hour. The four rows correspond to the top four energy channels from 0.279 to 2.361 keV.