by Schwadron et al.
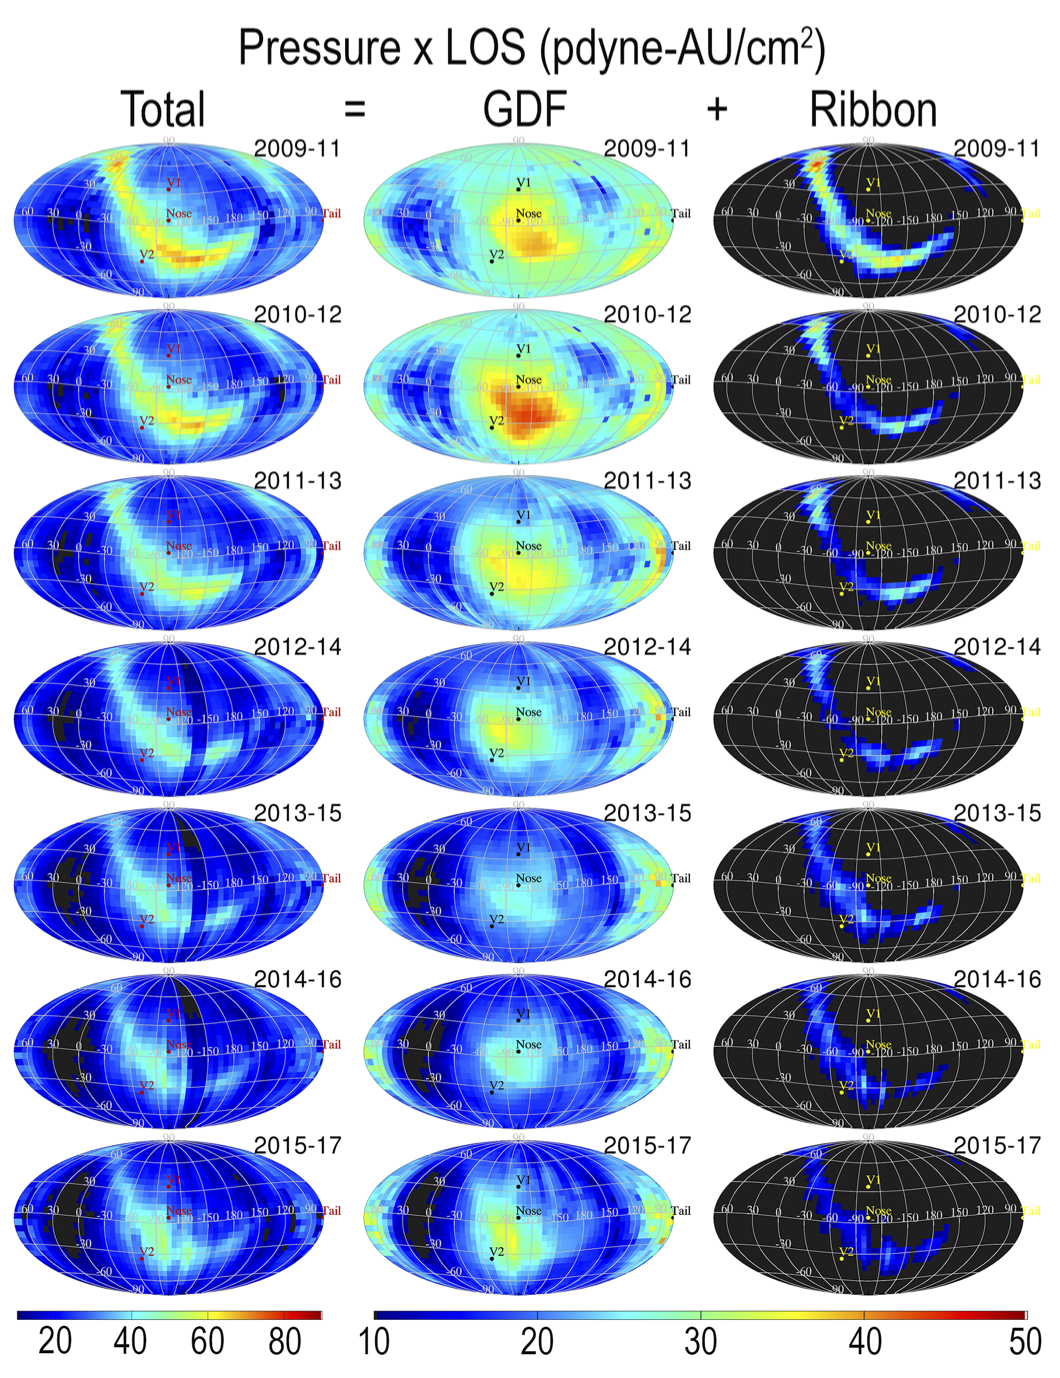
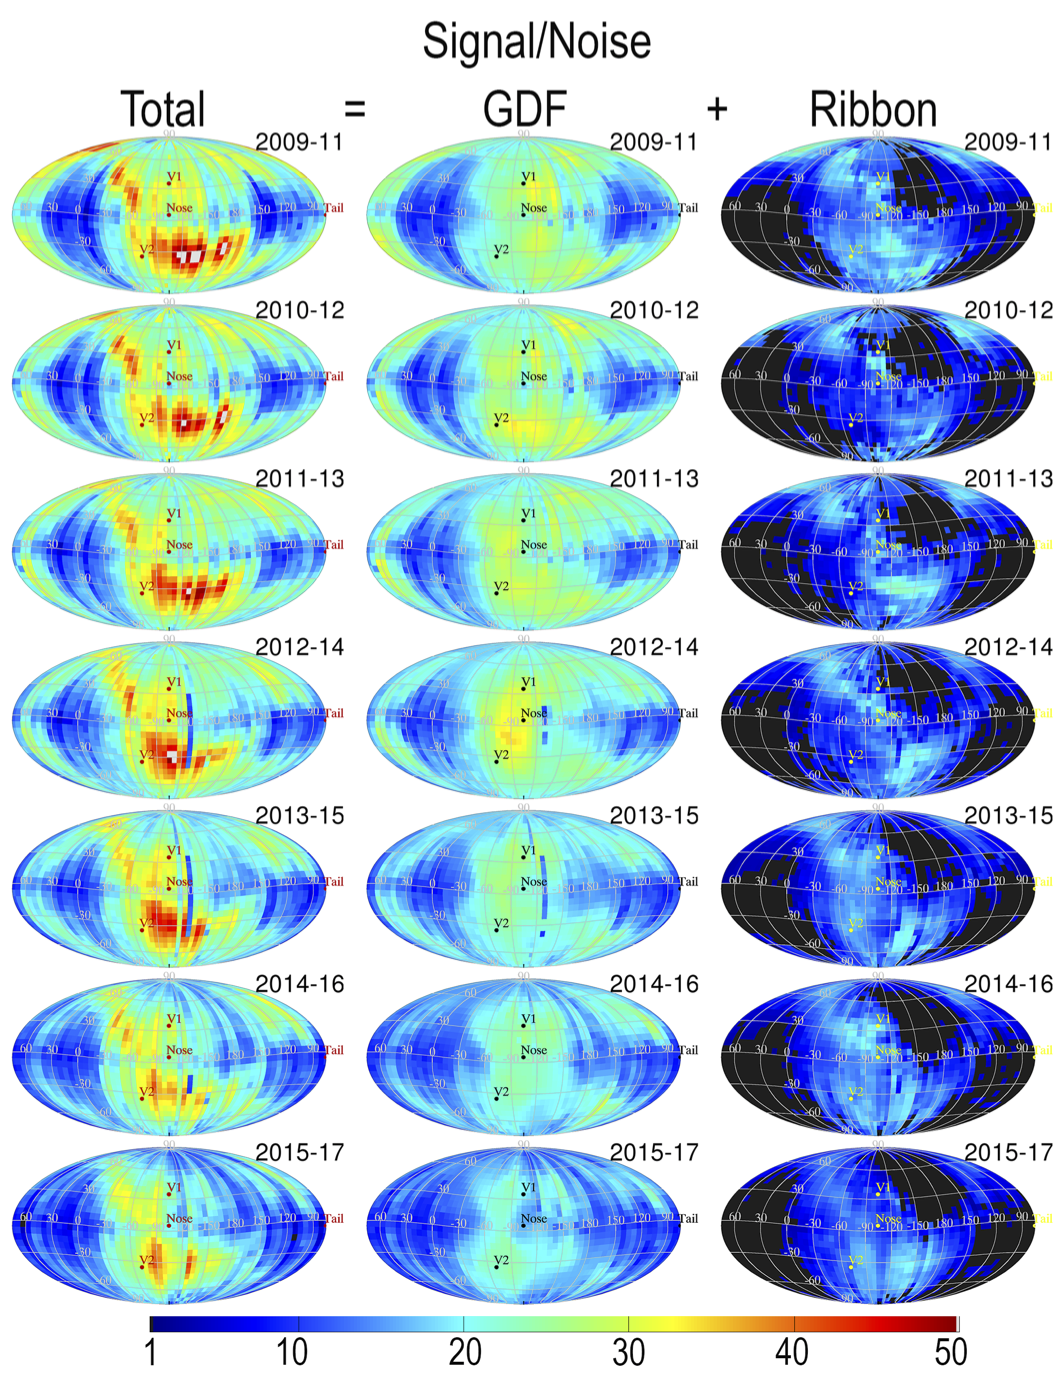
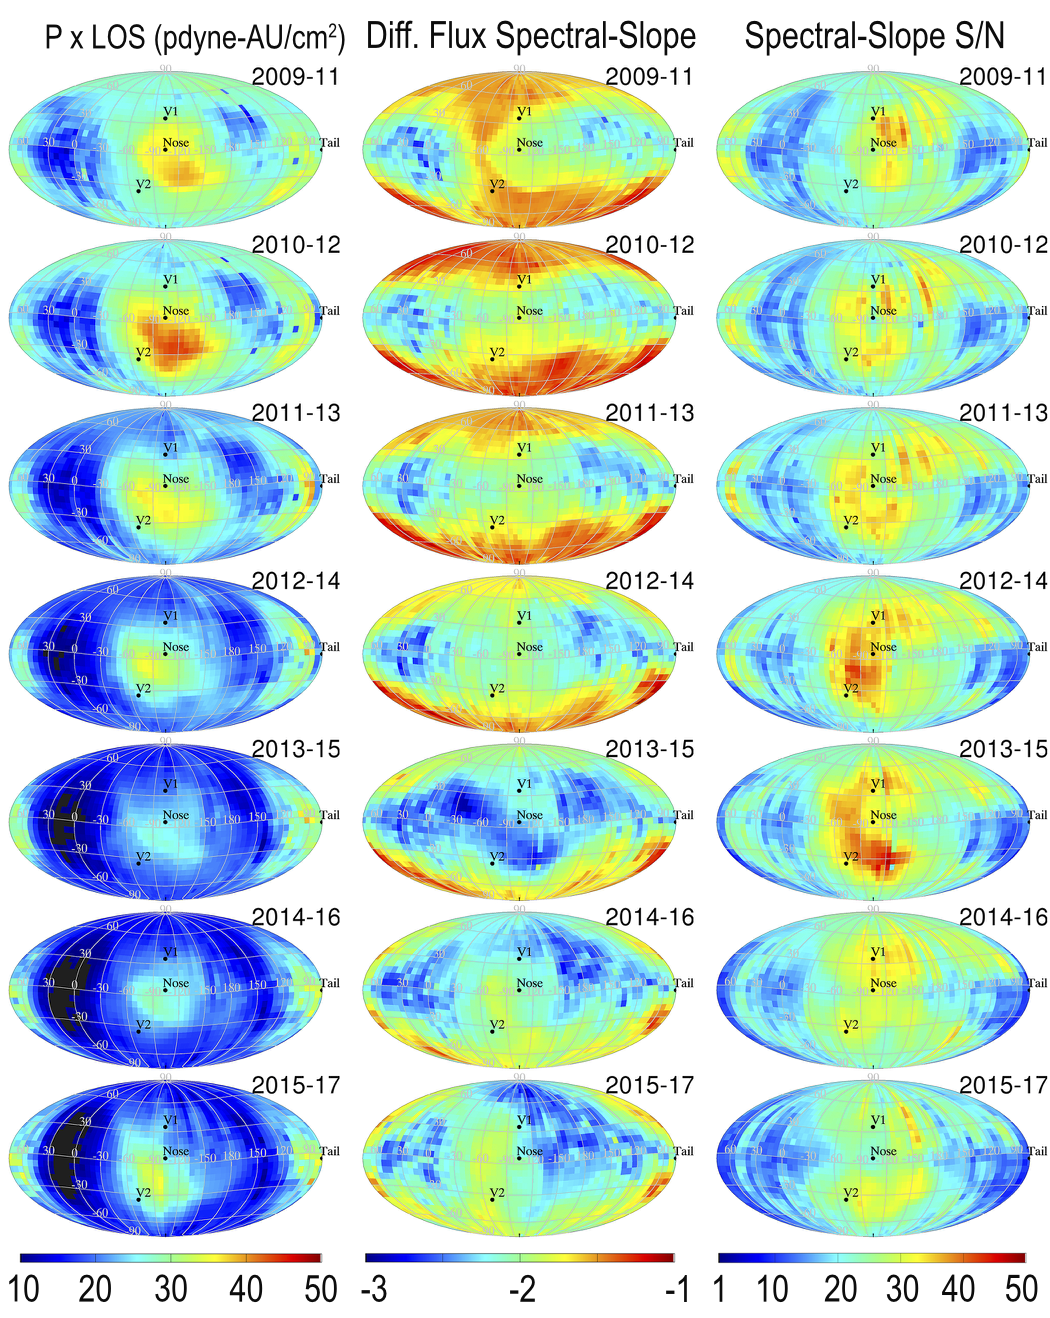
Abstract: Observations from the Interstellar Boundary Explorer (IBEX) of Energetic Neutral Atoms (ENAs) reveal two populations, those emitted from a narrow (∼20°−40°) ribbon that is centered on the local interstellar magnetic field, and a globally distributed flux (GDF) that is controlled by processes in the heliosheath. This is a third study utilizing a previously developed technique to separate ENA emissions in the ribbon from the GDF. In the first ribbon separation study, we analyzed the first year of IBEX data at the energies of 0.7 keV and above; the second study analyzed data down to 0.2 keV using the first five years of IBEX data. Here we utilize the separation analysis from 0.7 keV and above to study time-evolution in 3-year intervals over the first nine years of IBEX data. This study is the first to reveal the global time-evolution of the GDF distinct from that of the IBEX ribbon. We show that the time evolution of the GDF within 40° of the upwind pressure maximum is driven by changes in the solar wind ram pressure through compression and rarefaction in the heliosheath. In contrast the GDF is relatively stable in the region centered on the heliotail downwind with respect to the interstellar flow. The evolution of the IBEX ribbon is observed to have a time-lag with respect to the upwind GDF evolution, likely due to the secondary (neutral) solar wind source. The time-lag observed in the ribbon evolution is consistent with the generation of ions retained for several years beyond the heliopause. These observations lend further support for secondary solar wind models of the IBEX ribbon, but also require that there is a significant several year time-lag needed for re-neutralization of ions that form the IBEX ribbon. We use this study of the 9 year separation of the IBEX ribbon from the globally distributed flux to prepare for a formal IBEX data release of ribbon and globally distributed flux maps to the Heliophysics community.