Interstellar Neutral Helium in the Heliosphere from IBEX Observations. IV. Flow Vector, Mach Number, and Abundance of the Warm Breeze

by Kubiak et al.

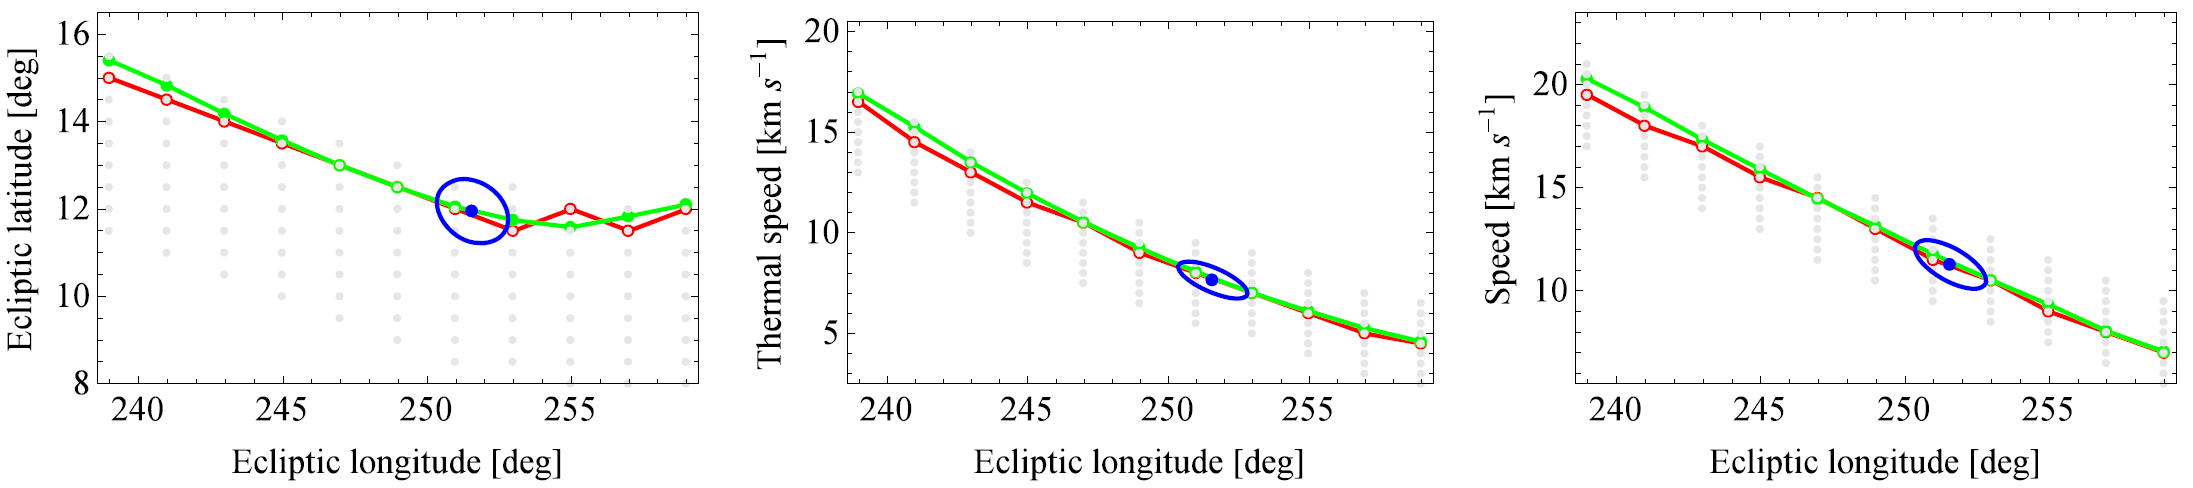
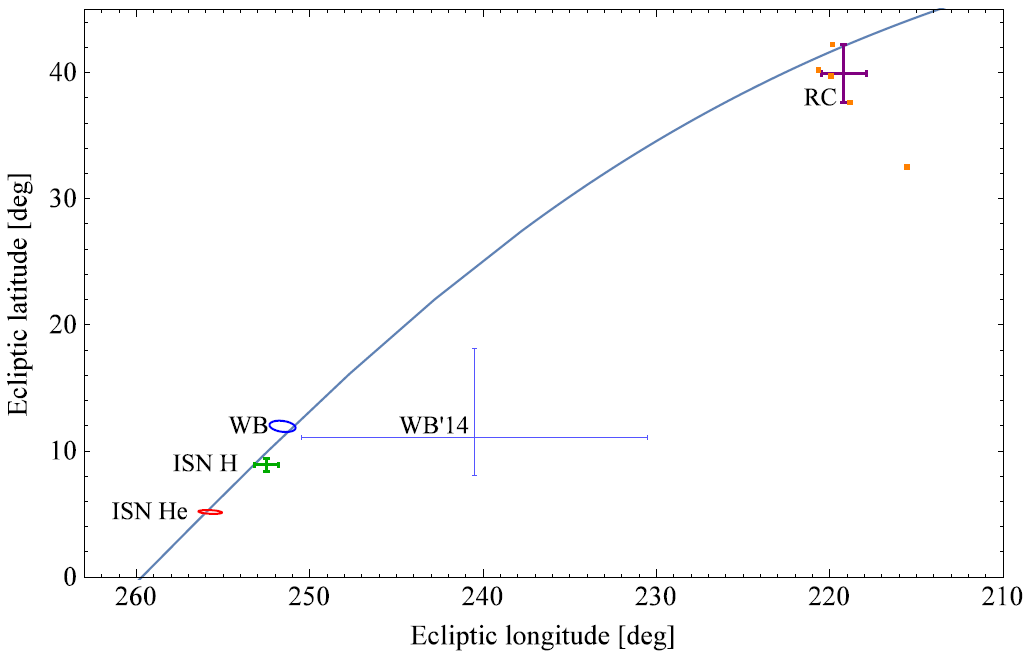
Abstract: Following the high-precision determination of the velocity vector and temperature of the pristine interstellar neutral (ISN) He via a coordinated analysis summarized by McComas et al., we analyzed the Interstellar Boundary Explorer (IBEX) observations of neutral He left out from this analysis. These observations were collected during the ISN observation seasons 2010–2014 and cover the region in the Earth’s orbit where the Warm Breeze (WB) persists. We used the same simulation model and a parameter fitting method very similar to that used for the analysis of ISN He. We approximated the parent population of the WB in front of the heliosphere with a homogeneous Maxwell–Boltzmann distribution function and found a temperature of ∼9500 K, an inflow speed of 11.3 km s−1, and an inflow longitude and latitude in the J2000 ecliptic coordinates 251.6°, 12.0°. The abundance of the WB relative to ISN He is 5.7% and the Mach number is 1.97. The newly determined inflow direction of the WB, the inflow directions of ISN H and ISN He, and the direction to the center of the IBEX Ribbon are almost perfectly co-planar, and this plane coincides within relatively narrow statistical uncertainties with the plane fitted only to the inflow directions of ISN He, ISN H, and the WB. This co-planarity lends support to the hypothesis that the WB is the secondary population of ISN He and that the center of the Ribbon coincides with the direction of the local interstellar magnetic field (ISMF). The common plane for the direction of the inflow of ISN gas, ISN H, the WB, and the local ISMF is given by the normal direction: ecliptic longitude 349.7° ± 0.6° and latitude 35.7° ± 0.6° in the J2000 coordinates, with a correlation coefficient of 0.85.

Data Products:

Figure 3 of Kubiak et al. 2016: Parameter correlation lines projected into 2D subspaces of the 4D parameter space, as a function ecliptic longitude. The gray dots are the simulation grid points. The red line connects the grid points for which the minimum χ2 value was obtained for a given longitude. The green line connects the results of inter-grid optimization, i.e., the χ2 minima found for the parameter subspaces deployed around the given node in longitude. The blue dots represent the locus of the absolute minimum of χ2 listed in the second row of Table 1 and the blue ellipses are the contours of projections of the 2σ 4D ellipsoid on the 2D parameter subspaces.
Figure 7 of Kubiak et al. 2016: Comparison of selected important directions on the sky. WB is the inflow direction of the Warm Breeze from the best-fit model obtained in this paper, with the uncertainty ellipsoid. WB’14 is the Warm Breeze inflow direction obtained by Kubiak et al. (2014), with the error bars. ISN He denotes the best-fit solution for the ISN He inflow direction obtained by Bzowski et al. (2015) from the analysis of IBEX ISN He observations from 2009–2014. ISN H is the direction of inflow of ISN H with error bars, determined by Lallement et al. (2010) from analysis of SWAN/SOHO observations of the heliospheric backscatter glow; this direction corresponds to the average flow of the primary and secondary ISN H populations. The small orange squares are the directions toward the center of the IBEX Ribbon, determined by Funsten et al. (2013) from observations from IBEX-Hi energy channels 2 through 6 (note they form a monotonic sequence in ecliptic latitude, with the directions for IBEX-Hi energy channels 3 and 4, the closest to the solar wind energy, being the second and third from the top). The purple cross is the average direction for energy channels 2–4, with error bars. The blue line is the great circle fit to the directions of the Ribbon center, ISN He, ISN H, and the Warm Breeze (see Table 2).